An Equivalent Circuit Model Reflecting the Current Dependency of Power Inductors and Evolving Simulations of Power Supply Circuits
Power inductors are one of the main components that constitute a power supply circuit. In a DC-DC converter, their effect is to suppress an alternating current, thereby smoothing out the electric current. However, they have dependency on the current; that is, their inductance values vary with DC superposition, which makes it hard for design engineers to choose right components or optimize their design. In response to customers’ request for more accurate and easier design environment, Murata has developed and started to distribute an equivalent circuit model that has reflected the current dependency of power inductors. Presented here is an outline of the product together with application examples to simulations.
What Is a Power Inductor?
Inductors may be broadly classified into two groups based on their applications: inductors for power lines and those for signal lines. Power inductors are components belonging to the first category, and they are used to smooth out an electric current in power supply circuits, such as a DC-DC converter. Murata offers two types of power inductors: a winding type and a monolithic type. Both of them use ferrites for a magnetic body (Fig. 1). Ferrites are ceramic compounds whose main constituent is iron oxide, and have a property to store magnetic energy in a highly dense manner. This property gives ferrite inductors poor permeability for the alternating portion of electric current, thereby exhibiting a great effect for suppressing noise or smoothing out the electric current. However, ferrites also exhibit magnetic saturation and magnetic loss.
Magnetic saturation is a state that an increase in externally applied magnetic field is no longer able to increase the magnetic flux density, thereby causing its magnetic energy to level off. The magnetic saturation of ferrites affects the DC superposition characteristics of power inductors. Figure 2 shows a measurement example of the DC superposition characteristics evaluated at 1MHz. As the DC current increases, the value of inductance shows a tendency to decline.
In the meantime, magnetic loss is a phenomenon where magnetic energy accumulated in ferrites is transformed into heat energy and is lost. Examples include hysteresis loss and eddy-current loss. When an electric current with a large amplitude flows in a power supply circuit, the magnetic loss in power inductors increases, thereby reducing the efficiency of the circuit. This suggests that it will be important to reflect the current dependency of power inductors in designing power supply circuits.
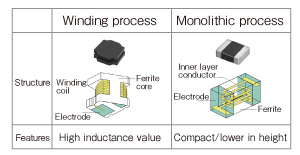
Fig. 1 Types of Power Inductors
Fig. 2 An Example Measurement of the DC Superposition Characteristics
Present Situation and Challenges in Designing Power Supply Circuits
Normal operation of electronic devices, such as mobile phones and laptop computers, requires a stable power supply circuit that has little fluctuation of voltage. Among others, DC-DC converters have changed from a traditional linear type to a switching type, achieving a substantial reduction in size and weight, and a remarkable improvement of efficiency. Recently however, while IC driving voltage has been becoming smaller, the electric current that flows in circuits has become larger, requiring the adaptation for the larger current and further miniaturization of power inductors. Because efficiency as well as miniaturization is considered important in power supply circuits, it requires the selection of components and the optimization of design that satisfy the desired efficiency. Figure 3 plots the relationship between the efficiency of an experimental DC-DC converter unit and the volume of power inductors to be built in. The output current was set to 200mA to measure the efficiency. Power inductors are monolithic type (LQM series, all 18 product types), and all other components are the same. In this figure, you see a trade-off between the efficiency and the volume of power inductors. Design engineers must take into account this kind of relationship to select the components and optimize their design.
Fig. 3 Relation Between the Efficiency and the Volume of the LQM Series (All 18 Product Types)
Optimization of design is an area where the application of simulations is anticipated, but in reality, trial and error experiments are used in quite a few power supply circuits. This is because simulations that take into account the current dependency of power inductors are difficult to accomplish, making it impossible to produce calculation results accurate enough to conduct the efficiency optimization. Figure 4 shows an example of traditional models provided by download at the Murata website so far. Traditional models, composed of only passive elements of LCR, are manufactured based on their characteristics when there is no DC superposition. Figure 5 compares the measured value of the DC superposition characteristics with their simulated value. The value of inductance declines as the electric current increases in the measured value, whereas the inductance value does not change in the simulated value. As this example suggests, the models that reflect no current dependency do not produce sufficiently accurate calculation results in simulations of the efficiency and response characteristics of a power supply circuit. Meanwhile, compatibility of speed and quality is strongly desired at the site of design work. To satisfy both, it is important to improve the accuracy of simulations to a practically acceptable level, and reduce the number of re-designing work or the number of prototypes constructed. In the design of a power supply circuit, because power inductors have a great impact on the performance of an entire circuit, it has been a challenge to develop an equivalent circuit model that reflects current dependency.
Fig. 4 An Example of the Traditional Model
Fig. 5 Comparison of the Measured Value and the Simulated Value of the DC Superposition Characteristics
An Equivalent Circuit Model That Reflects Current Dependency
Figure 6 outlines an equivalent circuit model that we propose this time. On the left is a basic circuit that reflects the circuit characteristics when a direct current has no superposition. The addition of inductive and capacitive circuits to the main resonant circuit helps correct the frequency characteristics of AC impedance (or Q factor). When there is a DC superposition, the characteristics, such as inductance, change. This effect corresponds to changing L and R in the main resonant circuit and the inductive circuit. On the right is an equivalent circuit model that can reflect the dependency of L and R due to the current. It consists of the basic circuit and an additional voltage source model. The voltage source model is an element that converts the effect of L and R varying with electric currents to voltages, and uses a current-controlled voltage source. The current-controlled voltage source is a component that can be used in the SPICE*1 simulator. It has capability to detect the current flowing into a circuit and calculate the voltage using specified mathematical functions. In this example, because we use a function that sets the voltage to zero (V) when the current is zero (A), the circuit that has no voltage source model agrees with the equivalent circuit model when there is no DC superposition. When there is a DC superposition, the voltage of the voltage source model varies with the current flowing into the circuit, thereby allowing users to conduct highly accurate dynamic simulations.
Fig. 6 An Outline of the Proposed Equivalent Circuit Model
Note that, in switching DC-DC converters, because a current with a large amplitude flows though the power inductors, the magnetic loss in ferrites becomes larger. To take this loss into account, parameters of the equivalent circuit model are derived based on the measured values of the amplitude that corresponds to actual operation.
Figure 7 compares the simulated and measured values of the frequency characteristics of LQM2HPN1R0MG0 power inductor (1μH, rated current: 1600mA). You can confirm that, the inductance (left) and the AC impedance (right) exhibit a tendency to decline respectively as the DC current increases, whereas both simulated (solid line) and measured (dashed line) values exhibit good agreement. We have achieved the average error of less than 5% over the measured frequency range (500kHz-30MHz).
Fig. 7 The Frequency Characteristics of Power Inductors
An Application Example to a DC-DC Converter
Next, we introduce an application example of the equivalent circuit model of power inductors to simulations of a DC-DC converter. Figure 8 shows an experimental DC-DC converter board used for comparison and a simulation model. The IC of the experimental board was LTC3612, made by Linear Technology Corporation. We conducted the experiment using an evaluation board provided for the IC. We conducted simulations, using LTspice*2 with the equivalent circuit model that we propose this time coupled to the installed IC model. The DC-DC converter was set to operate at an input voltage of 3.6V and an output voltage of 1.8V, with a switching frequency of 2MHz. LQM2HPN1R0MG0 was used as power inductors, and the efficiency and ripple currents were evaluated while the output current was changed from 1mA to 1600mA.
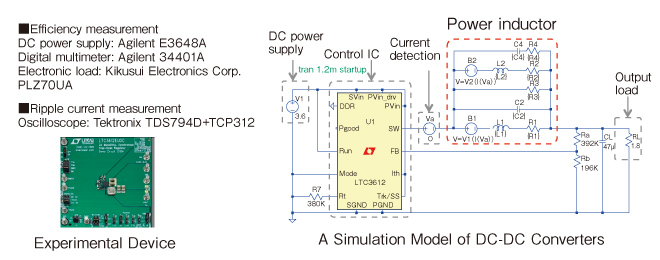
Fig. 8 An Experimental DC-DC Converter and a Simulation Model
Figure 9 shows the ripple currents flowing through the power inductors. By changing the load resistor, we compare the ripple currents at each condition that sets the output current to 500, 1000, and 1500mA respectively. The measured values of amplitude become larger as the output current increases. This is because the DC superposition characteristics lower the inductance values. You can confirm that, because the inductance values of the traditional model do not change, the difference becomes apparent as the output current becomes larger, whereas this proposed equivalent circuit model agrees with the measured values with good accuracy. The figure on the right shows the difference between the measured values and the simulated values averaged over one period. When the output current is 1500mA, the traditional model shows about 50%, whereas this proposed equivalent circuit model exhibits less than 2%, showing a markedly significant improvement.
Fig. 9 Ripple Current Flowing Through Power Inductors
Figure 10 compares the measured and simulated values of the efficiency. The presented simulation combined the results of this proposed equivalent circuit model and the traditional model. The traditional models are those which have no current dependency and have been offered at our website. Under the DC current ranging from 10mA to 200mA, the difference between the traditional model and the measured value reaches about 7% at most, whereas the difference narrows down to about 3% in the proposed equivalent circuit model. This is believed to be because the magnetic loss and the ripple current predicted by the equivalent circuit model came closer to the actual values.
Fig. 10 Comparison of Measured Value and Simulated Value of Efficiency
The effects of passive components other than the power inductors or the printed circuit board may account for the residual difference. Accurate reflection of these characteristics is expected to contribute to further improvement of the accuracy of calculation.
Conclusion
For the equivalent circuit model that we proposed this time, we have applied the model to our entire product lineup, preparing a software environment that we offer to our customers. The provided equivalent circuit model behaves dynamically in our customers’ simulators, allowing the customers to have more accurate and easier design environment. Murata has been promoting a service to provide a model library that enables batch processing of huge data groups for components such as MLCCs (Multi-Layer Ceramic Capacitors), by enhancing technical collaboration with EDA*3 vendors.
A design support software program SimSurfing*4 allows our customers to use the latest data more conveniently. By providing updated information in a timely manner, we will eliminate time spent on re-designs during the product design processes of our customers, thereby contributing to reduction in TAT*5 and cost.
Glossary
*1 SPICE:
An abbreviation of Simulation Program with Integrated Circuit Emphasis.A software program that simulates analog operation of electronic circuits.
*2 LTspice:
A free SPICE simulator offered by Linear Technology Corporation. There is no limitation on the number of elements.
*3 EDA:
An abbreviation of Electronic Design Automation. It is a generic term for software, hardware equipment, and methods for automating and supporting the design work of electronic systems.
*5 TAT:
An abbreviation of Turn Around Time. It represents the time frame from the planning and development phase up to the commercialization of a product.