4.1 Power Inductor Selection Using the DC-DC Converter Design Support Tool
Because power inductors are one type of functional component that make up DC-DC converters, they must be selected based on the various characteristics of the intended DC-DC converter.
Therefore, Chapter 3 explained the important characteristics of DC-DC converters that power inductors strongly influence.
Generally, power inductors are selected by evaluating the relative merits of these important characteristics through experimentation or simulation.
Moreover, as indicated in Chapter 1, there are components with various methods of construction even for power inductors with the same inductance.
Using Murata's representative power inductors as an example, the features of each component are indicated below.
DFE Series (Winding Metal Alloy)
Achieves superior performance in Itemp, Isat, Rac, and various other characteristics through the use of metal magnetic materials.
These power inductors are becoming major components in a wide range of markets in recent years.
LQM Series (Multilayer Ferrite)
The miniature size and low cost that are the strengths of this series originate from its structure. These inductors are often adopted for miniature devices that operate on a small current.
LQH Series (Winding Ferrite)
Noted for a broad lineup that even covers high inductance, this series can also support high-voltage and high-current applications.
Because there are various types of power inductors such as these, selecting based on trial and error through experimentation or simulation with all possible candidates cannot be said to be an efficient process.
Therefore, we offer the DC-DC Converter Design Support Tool, which has been prepared as part of the “SimSurfing” lineup of free design support software available for use on the Murata website as an easy way to select power inductors through a simple DC-DC converter circuit simulator and a library of high-precision power inductor characteristics.
This chapter summarizes Chapters 1 through 3 and explains how to select power inductors using the DC-DC Converter Design Support Tool from Murata.
4.2 What is the DC-DC Converter Design Support Tool?
The DC-DC Converter Design Support Tool is part of the SimSurfing family of tools from Murata and can be used as follows.
This tool makes it easy to calculate the following three parameters, which are important DC-DC converter characteristics that are strongly influenced by the power inductor performance as indicated in Chapter 3, for any power inductor (or capacitor).
In addition, this tool can also verify the power consumed, etc. by the power inductor under the actual specification conditions of the DC-DC converter.
This section provides an overview explanation of the following items followed by specific usage examples in the next section.
- Efficiency
- Ripple voltage
- Load response
- Power consumed by the power inductor
|
Rdc |
Rac |
L |
| Efficiency (During low load) |
- |
Smaller is better |
Larger is better |
| Efficiency (During high load) |
Smaller is better |
- |
- |
| Ripple voltage |
- |
- |
Larger is better |
| Load response |
- |
- |
Smaller is better |
Tool overview
The following table provides an overview explanation of the tool using the Murata Winding Metal Alloy DFE, Multilayer Ferrite LQM, and Winding Ferrite LQH inductors as examples. The following indicates the electrical characteristics for each inductance value.
[Inductance value: 1µH]
|
Rdc |
Isat |
| DFE252012F |
48 |
4.1 |
| LQM2HPN_GH |
63 |
2.0 |
| LQH2HPN_GR |
82 |
2.1 |
[Inductance value: 2.2µH]
|
Rdc |
Isat |
| DFE252012F |
97 |
3.1 |
| LQM2HPN_GH |
138 |
1.5 |
| LQH2HPN_GR |
160 |
1.55 |
Graph output form: the analysis results for the efficiency, ripple, and load response characteristic, etc. are output.
DC-DC converter operating conditions setting form: display example) Vin: 3.6V, Vout: 1.8V, Frequency: 2 MHz, Idc Max: 2A
Component selection form: select a product based on the product name and characteristic value.
4.3 Method for evaluating the efficiency evaluation
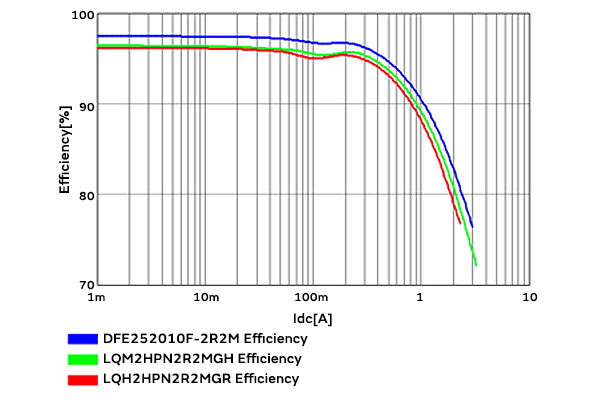
When the following three items are selected in the component selection form, the DC-DC converter conditions setting is set to Vin = 3.6V, Vout = 1.8V, Idc = 1A, and the switching frequency is set to 2 MHz or 6 MHz, the following graph is output.
|
L |
Rdc |
Isat |
| DFE252012F |
2.2µH |
97 |
3.1 |
| LQM2HPN_GH |
2.2µH |
138 |
1.5 |
| LQH2HPN_GR |
2.2µH |
160 |
1.55 |
The horizontal axis indicates the output DC current Idc [A], and the vertical axis indicates the efficiency [%]. From this result, we can see that the efficiency is better with the DFE252010F at 2 MHz while the LQM2HPN is superior at 6 MHz.
- Vin: 3.6V
- Vout: 1.8V
- Idc Max: 1A
-
[2MHz]
-
[6MHz]

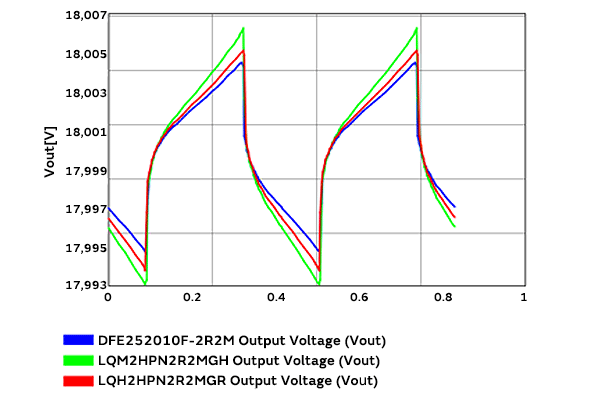
4.4 Method for evaluating the ripple voltage
The Output Voltage (Vout) graph is output in a manner similar to the efficiency.
The horizontal axis indicates the time [us], and the vertical axis indicates the voltage [V].
We can see that when the frequency increases, the ripple voltage decreases. Moreover, the DFE ripple voltage shows a tendency to decrease while the LQM shows an increase. This is caused by differences in L between DFE and LQM during DC current superposition.
-
[2MHz]

-
[6MHz]
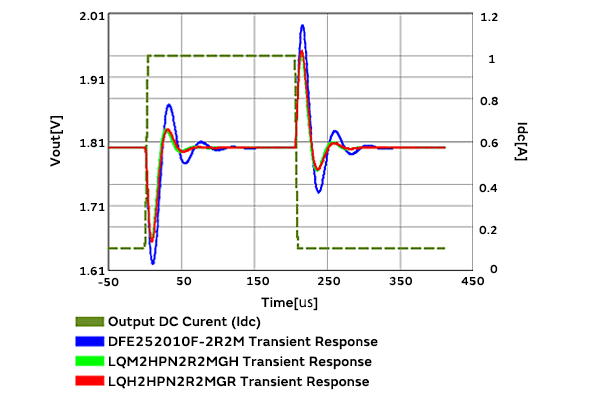
4.5 Method for evaluating the load response characteristic
The load response characteristic is output on the Load Transient graph.
The horizontal axis indicates the time [us], and the vertical axis indicates the voltage [V].
The load fluctuation conditions are set hereafter in the DC-DC converter operating conditions setting form.
This setting can be changed by setting the Setup Condition to Standard.
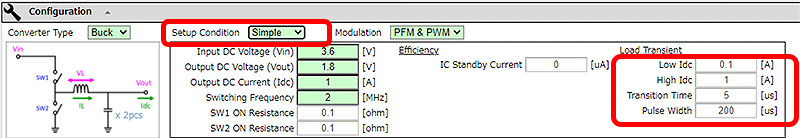 figure Load fluctuation
Because the response waveform of the load and the LC filter condition are not changed, the load response characteristic does not depend on the switching frequency here.
From this result, we can see that the LQM response characteristic is better than the DFE response characteristic.
-
[2MHz]

-
[6MHz]
4.6 Method for evaluating the power consumption of the power inductor
In the event that you wish to verify the power inductor and capacitor single characteristics, you must add a graph to be newly displayed from the options in the upper part of the graph display form.
Select “Inductor Loss” when verifying the power consumption of the power inductor.
Add the item to add the Inductor Loss graph.
The horizontal axis represents the output current [A], and the vertical axis represents the power consumption [W].
This indicator correlates with the efficiency, and the power consumption decreases as the efficiency improves.
Therefore, the power consumption decreases with the DFE at 2 MHz and the LQM at 6 MHz.
-
[2MHz]

-
[6MHz]

4.7 Selection examples using the design tool
This section presents power inductor selection case studies using IoT/miniature mobile equipment as examples.
The target application uses a lithium ion battery, which generally has a miniature size and low power consumption.
Therefore, there is a tendency to require a power inductor with a miniature size and high inductance value.
Select the optimal power inductor from a general circuit block when the DC-DC converter operating conditions are as follows.
DC-DC converter operating conditions:
- Vin: 3.6V
- Vout: 1.8V
- Frequency: 4MHz
- Idc Max: 100mA
Input the operating conditions for this case example in the DC-DC converter setting form.
DC-DC converter operating conditions:
- Vin: 3.6V
- Vout: 1.8V
- Frequency: 4MHz
- Idc Max: 100mA
4.8 Determining the inductance
Next, determine the inductance that is suited to the operating conditions of the DC-DC converter circuit.
The inductance of the power inductor is generally calculated with the following formula.
Here, we are expressing the output current ripple ratio and set the current amplitude ratio of the exponential current flowing through the power inductor with respect to the magnitude of the output current (figure below).
This parameter determines the balance between the ripple and load response characteristics that form a trade-off, and about 0.3 to 0.4 is generally thought to be appropriate.
If we calculate with the current operating conditions, we can see that about 6–10 uH is appropriate.
“r” is the output current ripple ratio
r = Ip-p/Idc
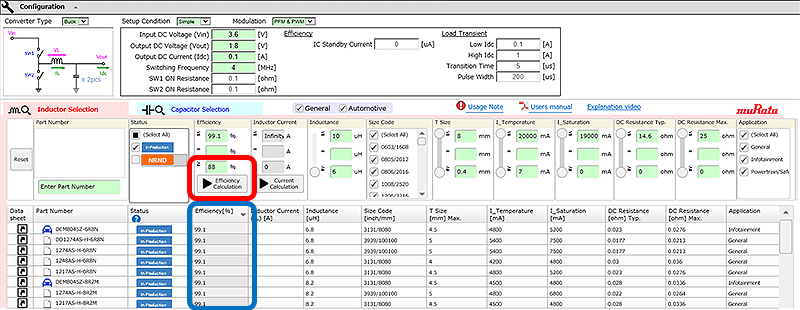
4.9 Inductor selection condition setting
When the inductance is determined, set the value in the “Inductance” field of the component selection form.
With just this setting, more than 100 types of power inductors come up as candidates, and we do not know which ones are appropriate.
Next, we sort by efficiency to narrow down the products.
To sort by efficiency, first select the “Efficiency Calculation” button and calculate the efficiency of the operating conditions (output current 100 mA) together.
When the efficiency calculation completes, the calculation result is added to the “Efficiency” item.
From this we can see which power inductors have better efficiency.
However, while large inductors appear as candidates, inductors for IoT/miniature mobile equipment do not appear.
* NRND products are excluded from the results.
Finally, miniature power inductors appear at the top by sorting by size.
Because there is a trade-off relationship between the efficiency and size, the optimal power inductor is selected by deciding which characteristic to emphasize.
In this case, the following two products can be presented as candidates.
- Emphasis on efficiency: LQM21DN100M70
- Emphasis on size: LQM18DN6R8M70
In addition, detailed efficiency and a comparison of products by ripple can be analyzed and evaluated by comparing the graphs shown in Chapter 4.2.
Summary
This chapter demonstrated that the various power inductor characteristics and the highly correlated DC-DC converter characteristic shown in Chapters 1 through 3 can be easily verified with SimSurfing (DC-DC Converter Design Support Tool) from Murata.
Moreover, simple selection case examples were provided.
Please check the manual for further details.
Using this tool makes it possible to select power inductors that take into consideration the major parameters without evaluating all of the inductor candidates in actual equipment or simulation, which can significantly reduce design man-hours.